


By Philippe Aghion, Antonin Bergeaud, and Luis Garicano* (with a postscript responding to Krugman’s answer)
In a recent series of Substack posts, Paul Krugman made a counterintuitive argument to support the view that Europe is not suffering any productivity decline relative to the United States. I (Luis), previously responded on Silicon Continent (with Pieter). Here, we clarify why a chain of current purchasing power parity (PPP) indexes does not tell us anything useful about productivity growth, or indeed “growth” more broadly. This is a version of our Project Syndicate column revised for clarity. There is a technical note by one of us (Bergeaud) with the gory details.
While a PPP measures purchasing power across places at one moment, a deflator compares prices across time in one place.
PPP is useful for comparing purchasing power across countries at a point in time. But a sequence of current-PPP comparisons is not automatically a measure of real growth, because the prices used to value output change from year to year.
Since 1986, The Economist has published its “Big Mac” index, tracking the price of Big Macs in each country. Suppose a Big Mac costs $6 in the US and €5 in the eurozone. At a market exchange rate of $1.10 to the euro, the European burger costs $5.50, meaning the euro is a bit undervalued. For a Big Mac to cost the same in both places, the euro would have to strengthen to $1.20 per euro. This is the PPP: the exchange rate implied by what money actually buys.
A PPP is a form of exchange rate, built from the prices of actual goods rather than from financial markets. It is a comparison across space. The Big Mac works because the product is unusually standardized: a Big Mac in France and a Big Mac in the US are close enough that comparing their prices tells us something meaningful about relative purchasing power.
A price deflator does the opposite: it compares one country’s prices over time. The US sold far more in 2024 than it did in 2000, but some of this is due to inflation. To remove the impact of inflation, statisticians build a deflator: an index of how domestic prices have moved, year by year, so that higher prices are not mistaken for higher production. The deflator answers a different question: how much more the US produced in real terms.
You could string together 25 years of Big Mac indexes, but that would only measure how the relative price of one product changed across countries. That is moderately useful for comparing economies at a particular moment. It is useless as a measure of total output growth through time.
On top of that, the Big Mac is the exception. Most products are not so neatly comparable across countries. They differ in quality and in how representative they are of what people buy. That is why Angus Deaton famously said in his 2010 American Economic Association presidential address that “PPP comparisons between widely different countries rest on weak theoretical and empirical foundations.”
The two price indexes need not agree
Both are price indexes, so it is tempting to assume they fit together cleanly. But a current-PPP trajectory changes the yardstick every year: each year’s output is valued using that year’s international price system. When the PPP path and the national deflator path diverge, current-PPP growth mixes changes in quantities with changes in the prices used to value those quantities. Nothing causes the two to agree, even when both are built perfectly: there is no theorem that a new PPP equals an old one carried forward by relative inflation.
The companion technical note makes this statement formally: if you take the current-PPP comparison of France and the US, and difference it across years, you do not recover the difference in their real growth. You recover that difference plus a price residual: the amount by which the cross-country PPP moved away from what the two countries’ own inflation rates predict. That residual carries no information about how much more either country produced, and it is the entire source of the disagreement.
The disagreement between these two measures is shown in the chart below, which compares two lines, each set to zero in 1995. The blue line is the actual France-US PPP as their statistical agencies build it each year. The orange is what that parity would have been if you had taken the 1995 figure and simply carried it forward using each country’s own deflator—its own inflation. If the two indicators measured the same thing, the lines would be on top of each other.
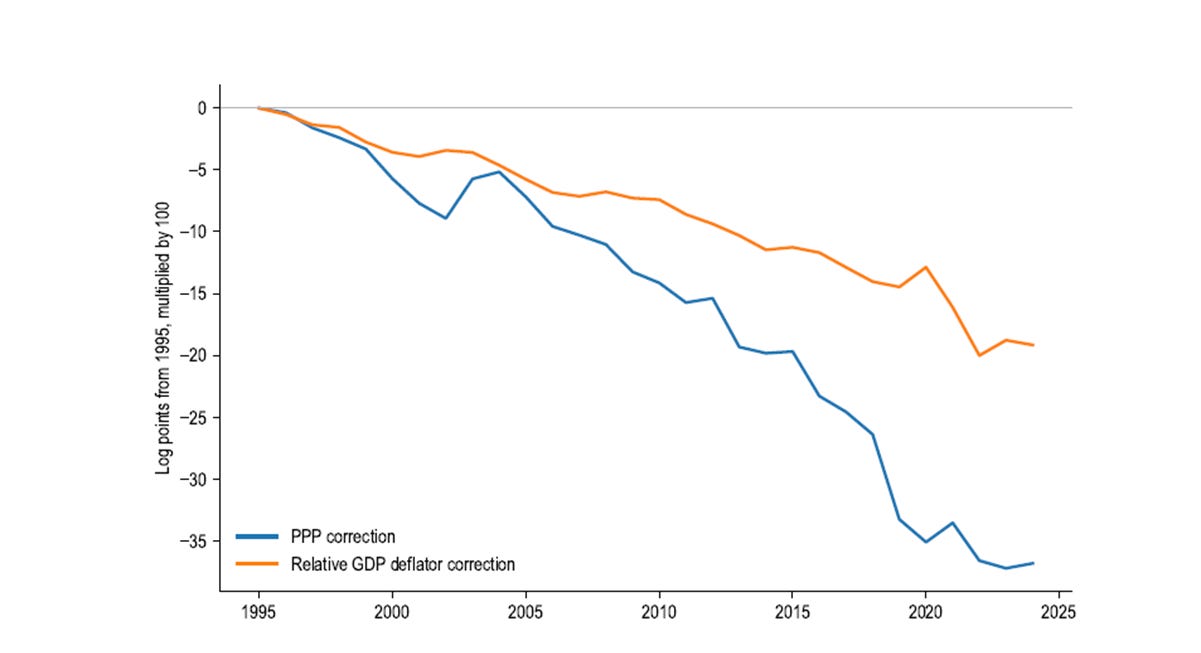
France and the US. 1995 = 0. In blue, the change in the France-US PPP. In orange, the change the two countries’ national deflators would predict. If a PPP were simply an old comparison updated for inflation, the lines would coincide. Source: OECD.
The lines track together until about 2005, then split. By 2024, they are roughly 18 log points apart. That gap is large enough to neutralize nearly all the measured growth divergence between France and America. Current PPPs and national deflators are giving sharply different answers to what at first sight looks like the same price question. Indeed, a 2026 research note by Robert Inklaar finds the same divergence and shows it is economically large in recent Europe-US comparisons.1 The gap is much smaller when France is compared with several large European countries.
There are two reasons for this lack of coincidence: one is the problem of measuring technological progress; the other is the way the baskets are constructed.
The problem of technology
Krugman cites the finding by the Federal Reserve Bank of Chicago that information technology is about 8% of US private-sector output but produced about 45% of all American productivity growth since 1988. This is exactly the kind of sector where measurement is difficult. The volume produced has exploded, the price per unit has collapsed, and the quality of the products has changed enormously.
There are two ways this can create a wedge. The first is a weighting issue. If the US produces more of the goods whose prices fall rapidly, then valuing both economies at today’s prices can make part of the earlier volume gain look smaller. The following chart, from a May 2026 paper by Charles Jones and Christopher Tonetti, shows that the increase in the quantity of computers sold took place at the same time as an even larger decrease in the price of computers, leading to a drop in the share of value added of computers.
The Share of Factor Income Paid to Computers
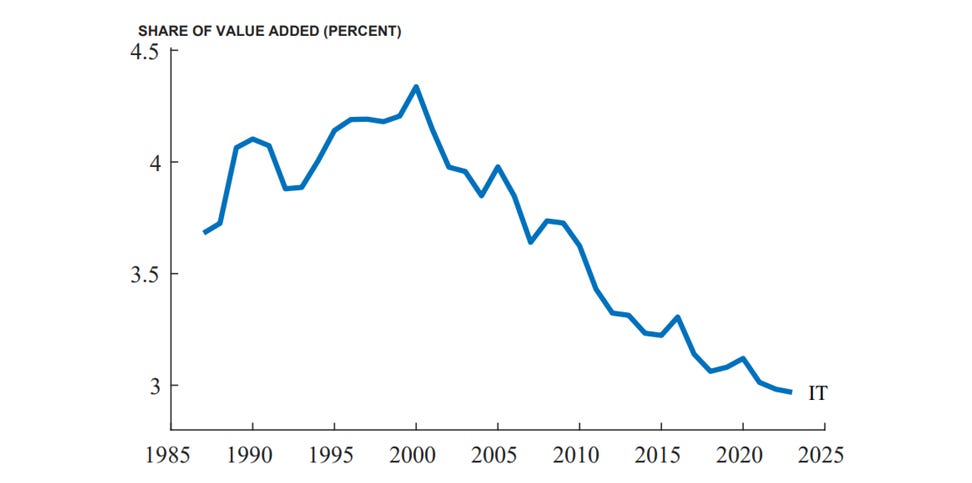
The factor-income share of information technology in the private business sector in the US. Source: Jones and Tonetti (2026) with data from the Bureau of Labor Statistics.
The second concerns quality adjustments. National deflators aim to account for quality and technological progress over time. They ask how the price of mobile-phone services and devices in France changed between 2023 and 2024, after adjusting for changes in quality. If this year’s phone is more expensive than last year’s phone, the statistician must account for how much of the increase is true inflation and how much reflects higher quality.
By comparing products at the same date, PPP tries to avoid that problem. If the same phone is sold in France and in the US in 2024, the PPP survey can compare the two prices directly. It does not have to ask whether the 2024 phone is better than the 2023 phone, but whether French and US products are sufficiently similar at that date. A sequence of current PPPs never makes this adjustment over time, and so never records the technological progress the deflator builds in year by year. Where products improve fastest, as in information technology, that gap is largest.
If a country doubles its computer output while the international price of computers decreases to half the old price, current PPP records no increase in value. The quantity gain has been offset by a change in the price yardstick.
How the sausage is made
But there is a more structural problem: There exists no basket of products that is simultaneously representative within each country, comparable across countries, and stable through time. The technology section made the point about the failure of stability over time; here we tackle the clash between a representative basket and one that is comparable across countries.
Consider mobile phones. A PPP comparison would ideally compare the price of the same phone in France and the US. That sounds simple if both countries sell the same iPhone model. But even then, the relevant product may differ in contract provisions, taxes, distribution, or regulation.
Things get even more complicated once we move from standardized products to categories shaped by local tastes. Comparing Brie cheese in Paris with cheddar in Chicago would be meaningless. But comparing only Brie in both countries would also be misleading, because Brie may be representative in France and niche in the US.
The objective of the PPP construction is to price goods that are both comparable across countries and representative within each, and those two demands conflict.
The two indexes differ because they pick the basket of products by different rules. A national price index needs items that represent what its own country buys, and that is the only test it must pass. France can track a baguette, the United States can track whatever bread Americans buy, and each follows its own goods through time. To hold comparability, the International Comparison Program does not name brands and instead writes out the features that set a price, so that two countries pricing rice price the same quality grain. It marks each item as typical or not in each country.
The program cuts GDP into roughly 155 basic headings, the smallest groupings for which it knows how much each country spends. The France-US parity in our chart is the output of one such system, the comparison that Eurostat and the OECD run jointly, which prices a shared list of about 2,500 consumer goods and services, and runs without pause rather than in benchmark years. It matches those products across countries at each date. These are different baskets that answer different questions, which is why the parity and the inflation paths do not line up. Inklaar (2026) shows that even when similarly named price categories are matched across the two methods, a large gap survives, due to the specific products sampled within each category, not to the weights placed on them.
Seven time series, one conclusion
The table below puts the issue in perspective. The first seven rows report standard real labor-productivity growth: GDP is transformed using national deflators, from national accounts and related datasets. The last row reports growth in output per hour when GDP is converted every year using current PPPs.
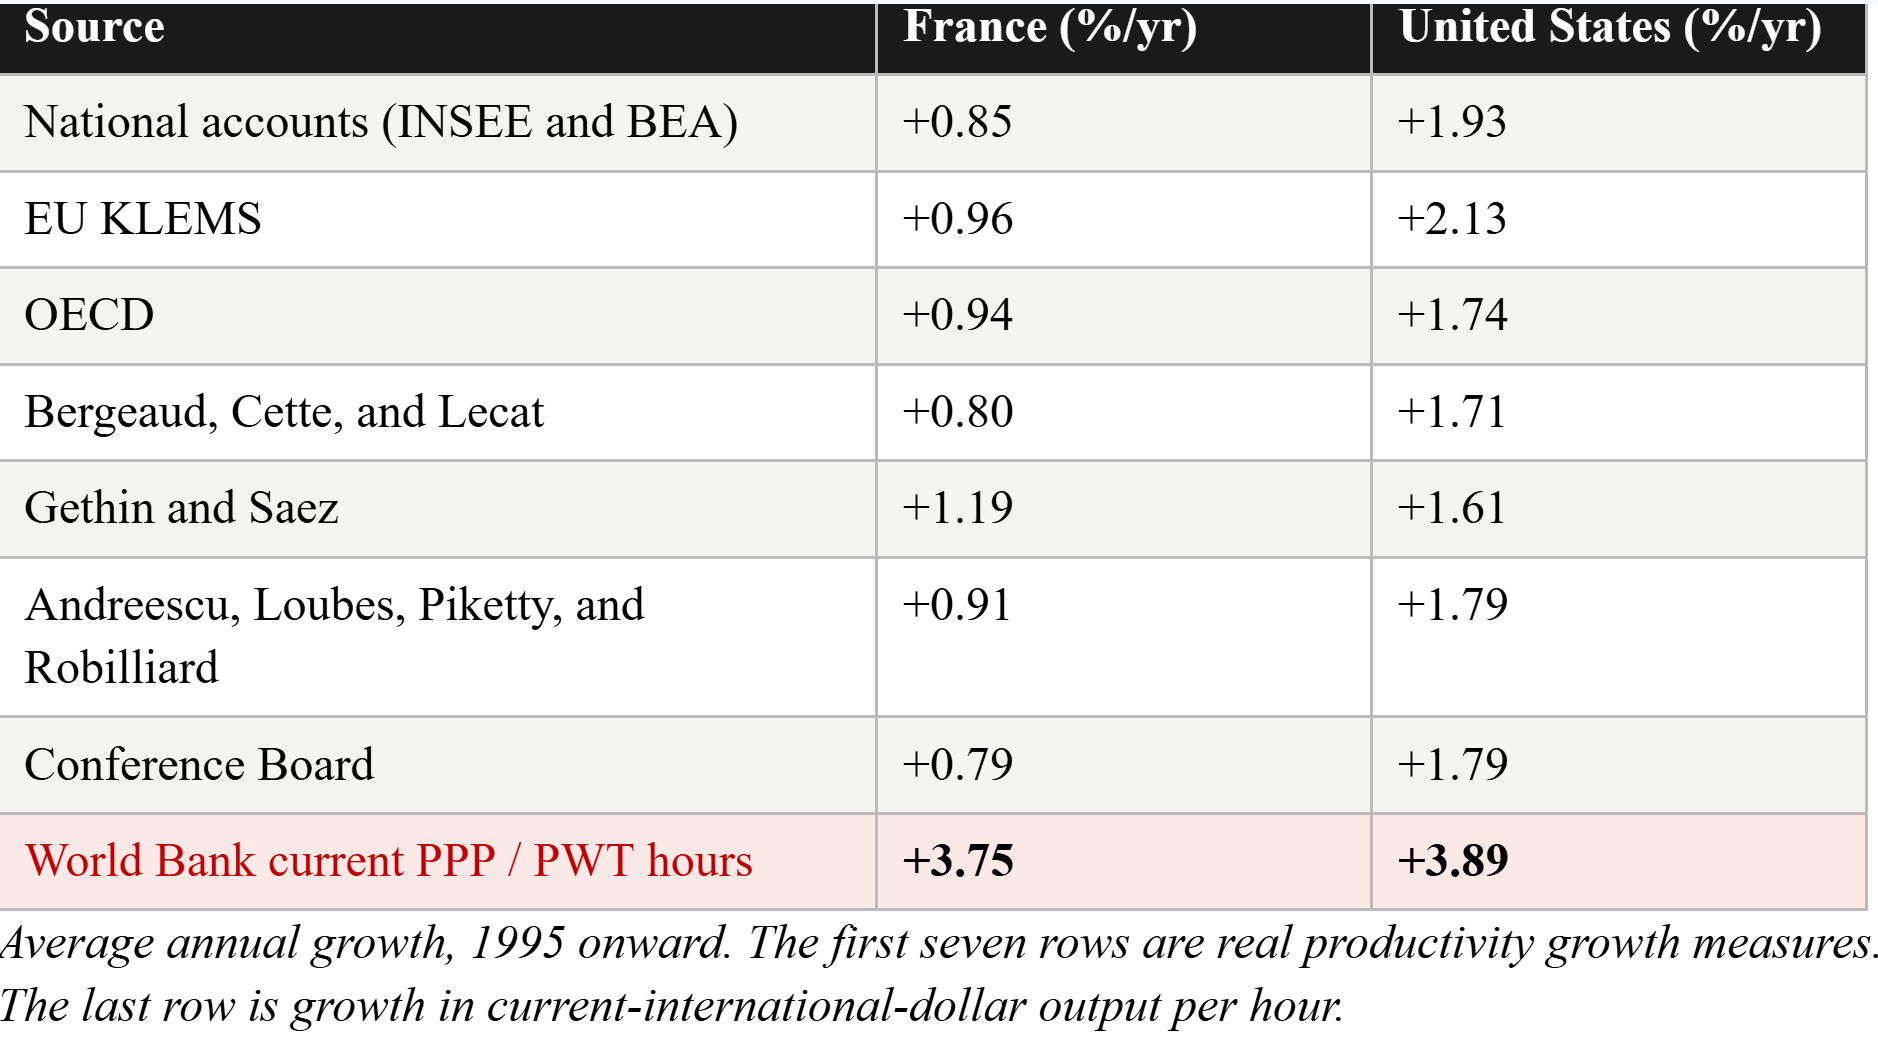
The first seven rows are the product of different teams, different datasets, and different methods, though most ultimately rely on national accounts. They agree that US productivity has grown substantially faster than French productivity for three decades.
Now read the last row. Convert GDP every year with a current PPP, as in the Krugman-style calculation, and, voilà, French output per hour grows at a similar rate to the US. The match is built by the conversion. The United States anchors the international dollar, so its PPP equals one and the yearly conversion leaves it untouched: its 3.89 is the growth in nominal output per hour, real productivity of around 1.9 percent on top of a US GDP deflator of 2 percent. France’s 3.75 carries the same two parts and one more: French real productivity, plus that same American deflator, minus the gap between the France-US PPP and the two countries’ relative inflation. Because the PPP falls faster than relative inflation can account for, that gap is negative, and subtracting a negative number lifts France’s figure by almost the whole point that its real productivity, at 0.85, trails the American 1.93. The two rates nearly meet because one US deflator inflates both and the price gap erases the real difference between them. Nothing in the last row measures how much more either country produced.
Contrary to Krugman’s argument, the US lead in technology and innovation is not helping America and Europe in the same way. It has led to higher US wages and profits, and the gap is widening each year.
So, Europe’s productivity problem is not an accounting issue. As Krugman himself once famously remarked, “productivity isn’t everything, but in the long run, it is almost everything.” Productivity growth pays for everything Europe wants to keep. It is what allows countries to raise wages, fund a welfare state, rearm, finance the green transition, and support research at the technological frontier.
We Europeans should not persuade ourselves that we do not have a real problem by confusing productivity levels with growth. We have real weaknesses, as Mario Draghi’s report on European competitiveness documented—and as all researchers and international institutions find every time they look.
In our view, these findings are not controversial. The European Union’s markets remain too fragmented. Europe’s firms stay too small. Its capital markets are insufficiently deep. And its technology, particularly digital tools, diffuses too slowly. And Europe has too few technology companies built to global scale.
These are policy choices, not fate, and they can be changed. But we in Europe will fail to change them if citizens and leaders persuade themselves that the productivity gap is an illusion because one price index makes it look smaller.
PPP is a useful instrument. It tells us what money buys in different places. But a sequence of current PPPs changes the valuation benchmark over time, and therefore cannot by itself settle a question about real productivity growth. Europe should defend what it does well. But we should be upfront about where and why we are falling behind. Otherwise, we will not cure what ails us.
Postscript in response to Krugman’s answer: Krugman has answered to the earlier version of this piece which ran in Project Syndicate, in a post dated May 30. Krugman and we agree that (1) European productivity growth has trailed the United States for three decades, and Krugman says so clearly (”I am not arguing that European productivity is mismeasured, and never said that.”) (2) Current-PPP chain and a national deflator answer different questions. (3) The weighting mechanism by which an economy that produces goods with falling relative prices sees part of its volume gain valued away, is part of the channel to explain the paradox. We disagree still on one crucial question: Krugman reads the flat current-PPP line as evidence that Europe is not falling behind, while we see it as the product of moving the price measurement stick every year. Hence we do not see the current- PPP line as indicative of anything interpretable.
We are comfortable considering that measuring growth only with national deflators is not perfect and that there is a case to support the idea that Europe falling behind may be hard to fully and precisely appreciate with one number. The precise size of the gap is open to honest argument. Two things are not. Current PPP does nothing to repair this; it trades one measurement problem for a larger one by re-pricing output every year. And for the measured decline to be an artifact rather than a fact, the error would have to be enormous: the divergence is roughly a point of annual productivity growth each year for three decades, close to eighteen log points by 2024. No quality adjustment anyone has proposed comes within reach of that.
Krugman asks us to confront the possibility that Dutch output per hour sat about 25 percent above the American level in 2000 and has fallen toward it since. He sees this as a reductio ad absurdum: surely the Netherlands was not that much more productive a generation ago. We are quite comfortable with the possibility that the Netherlands was ahead in 2000 and it has been falling behind the US year after year. This is Europe’s productivity problem, which the current-PPP comparison hides and which is the whole point of the last row of our table.
*Philippe Aghion is a 2025 Nobel laureate in economics and a professor at the Collège de France and at INSEAD and a visiting professor at the London School of Economics. Antonin Bergeaud is Associate Professor of Economics at HEC Paris. A version of this piece was published in Project Syndicate on Friday 29th. We revised it to clarify the table interpretation and the way PPP indexes are built and also reordered some paragraphs to increase clarity. Paul Krugman has answered to this piece, but our revision was done before his answer-only the postscript incorporates them.
Inklaar, R. (2026, April). Comparing PPP changes with relative inflation: Evidence from PWT, Eurostat/BEA, and official PPP statistics. Draft research note.
"Krugman asks us to confront the possibility that Dutch output per hour sat about 25 percent above the American level in 2000 and has fallen toward it since. He sees this as a reductio ad absurdum: surely the Netherlands was not that much more productive a generation ago. We are quite comfortable with the possibility that the Netherlands was ahead in 2000 and it has been falling behind the US year after year. This is Europe’s productivity problem, which the current-PPP comparison hides and which is the whole point of the last row of our table."
The constant price productivity dataset has much stranger implications than merely accepting the Netherlands was 20% more productive than the United States in 2000:
(1) Italy was also 20% more productive than the United States in 1995.
(2) Spain was also more productive than the United States in 1995.
(3) The United States would have been one of the poorest nations in Western Europe by this metric even before the monetary union.
https://data-explorer.oecd.org/vis?lc=en&tm=productivity&pg=0&snb=585&vw=tb&df[ds]=dsDisseminateFinalDMZ&df[id]=DSD_PDB%40DF_PDB_LV&df[ag]=OECD.SDD.TPS&df[vs]=1.0&dq=ESP%2BAUT%2BFIN%2BUSA%2BITA.A.GDPHRS..USD_PPP_H.Q...&to[TIME_PERIOD]=false&pd=1995%2C
Measuring productivity in 1995 based on 2025 prices is a bad approach for cross-national comparison that leads to the exact paradox Krugman describes; this is treating the US high tech output as less valuable than it was at the time. Using the current price data is a better approximation for what we are actually trying to measure: economic welfare.
We as Europeans shouldn't delude ourselves into thinking cold war Europe was much richer than the United States. This problem is well documented and there have been attempts to rectify it, the PWT dataset explicitly tries to tackle this problem by measuring using an adjusted deflator that allows the prices of products to vary over time and not relying on the tabulation in national datasets as much as the OECD and WB do.
https://www.rug.nl/ggdc/docs/the_next_generation_of_the_penn_world_table.pdf
https://ourworldindata.org/grapher/labor-productivity-per-hour-pennworldtable
These datasets suggest that Western Europe has been a relatively close follower since 2000, hovering below the US at 80-90% of US productivity and mostly less than that using the current price TFP. It's instructive here to point out (as Garicano et al. have repeatedly stated across posts) that we also shouldn't delude ourselves into thinking economic reform is not necessary (even if wage & GDP growth are fine). To what extent Europe's tech lag is a security problem is related but still largely adjacent to what extent it is an economic problem.
But doesn't this still miss the broader point about standard of living that grounded some of Krugman's original posts on this debate many weeks ago? https://paulkrugman.substack.com/p/is-europe-in-economic-decline I understand that grounding these discussions in the proper evaluation of productivity data is important, but it looks like you're missing the forest for the trees here. Has this productivity gap that you all assert exists led to read differences in standard of living between the U.S. and Europe?